
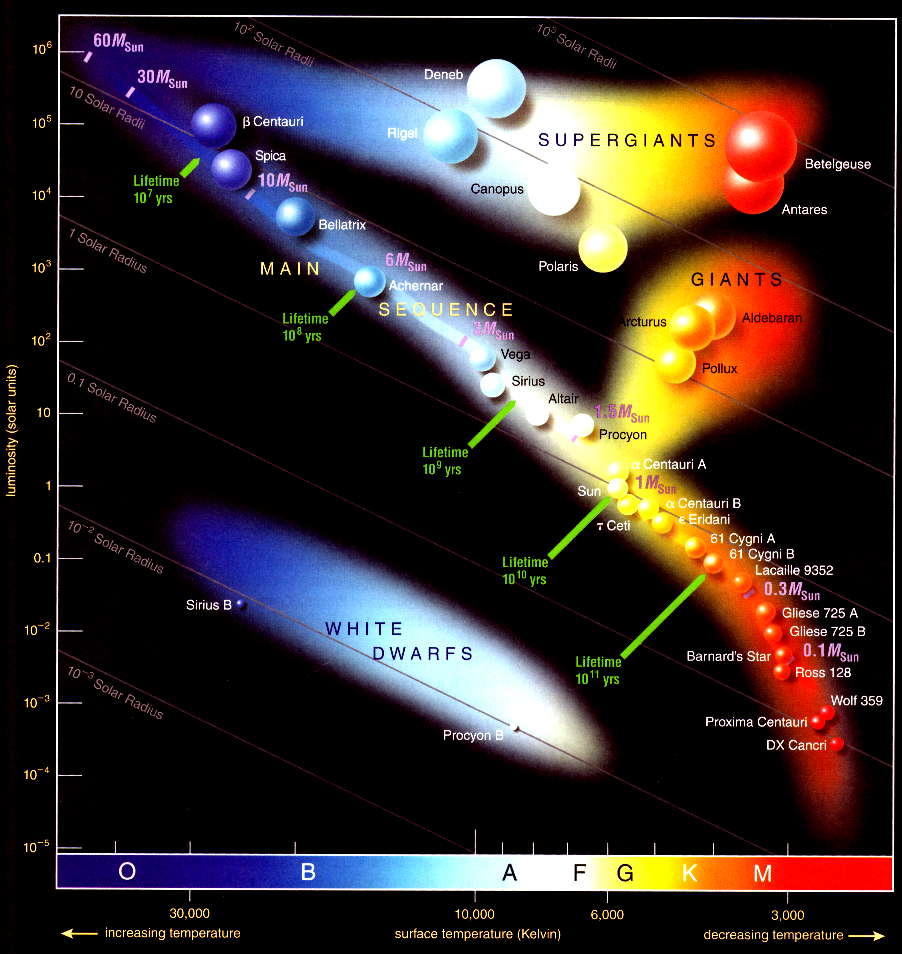
 E. Hertzsprung and H. Norris Russell studied the relation between the absolute magnitude (or luminosity) and spectral types (or surface temperature) of stars. The diagram showing these two variables is known as HR diagram. This HR diagram represents a major step towards an understanding of stellar evolution.
Stars in the stable phases of hydrogen burning lie along the main sequence according to their mass. The mass and population of star decreases from type O to type M. The sun is situated about the middle of the main sequence. After a star (lower masses) uses up all the hydrogen in its core, it leaves the main sequence and moves towards the red giant branch. The massive stars becomes red/blue supergiant (upper right corner of the HR diagram) as it exhausts hydrogen burning at the core. The lower left corner is reserved for the white dwarfs.
The spectral class constitutes a temperature sequence, hot O star on the left and cool M star on the right. The statistical distribution of data on HR diagram demonstrates that stars fainter than the sun are far more numerous than those brighter than the Sun. In general about 90% stars are main sequence stars, about 9% are white dwarfs and about 1% are red giant or supergiants.
As a star consumes hydrogen it gradually becomes cooler. When the hydrogen supply is exhausted, the star core contracts, its atmosphere expands, and it becomes a red giant or supergiant. It evolves off the main sequence at a point called the turnoff point. At it burns the hydrogen in the shell, it is on the red giant branch. If it is massive enough, the temperature of the collapsing core can become hot enough for helium burning to start. When a star is burning helium in its core, it is a horizontal branch star. The asymptotic giant branch stars possesses both hydrogen and helium shell burning.


