
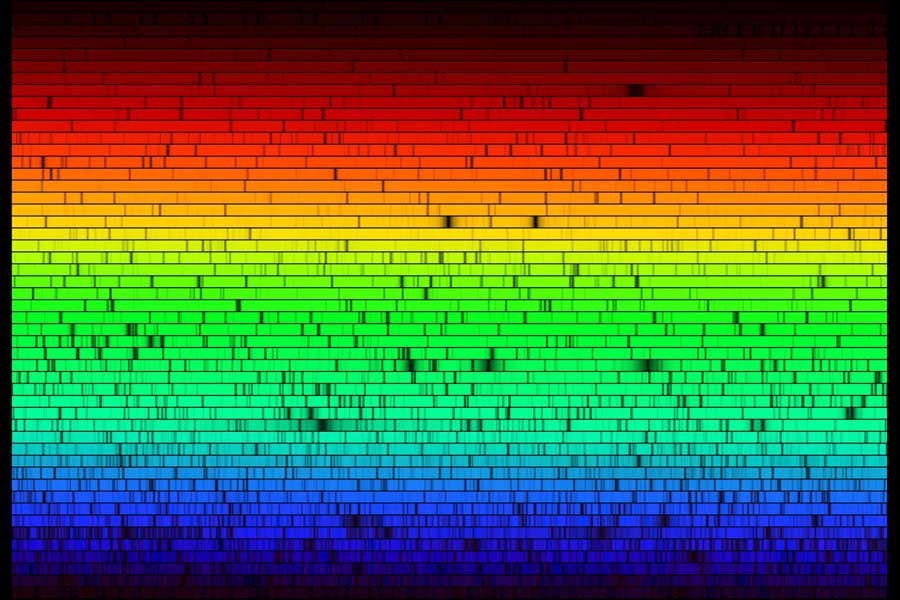
 The spectra of stars are classified on the basis of the strength of the spectral lines. In 1666 Newton claimed to observe solar spectrum but no details can be found. In 1814 Spectroscopy began when J. Fraunhofer observed the dark lines in the spectrum of the Sun. He named some of the stronger dark line as D, G, H and K without knowing the elements responsible for the origin of these lines. These lines are called Fraunhofer lines. In 1860 Gustav Robert Kirchhoff and Robert Bunsen identified these lines as the characteristic lines produced by various elements in the outer space of the star.
Absorption spectrum is produced when a continuum passes through “cooler” gas. Photons of the appropriate energies are absorbed by the atoms in the gas. Photons are effectively removed from the beam of light, resulting dark lines.
The atmosphere of stars acts as a cooler blanket around the hotter interior of a star so that typical stellar spectra are absorption spectra.
The classification of stellar spectra was begun by Henry Draper (1872). Later Harvard observatory continued his work. The first catalog was named after Henry Draper as HD catalog. It contains spectral classification of 225,000 stars. The Harvard classification is based on lines that are mainly sensitive to the stellar temperature rather than to gravity or luminosity.
The Harvard classification are denoted by the following capital letters

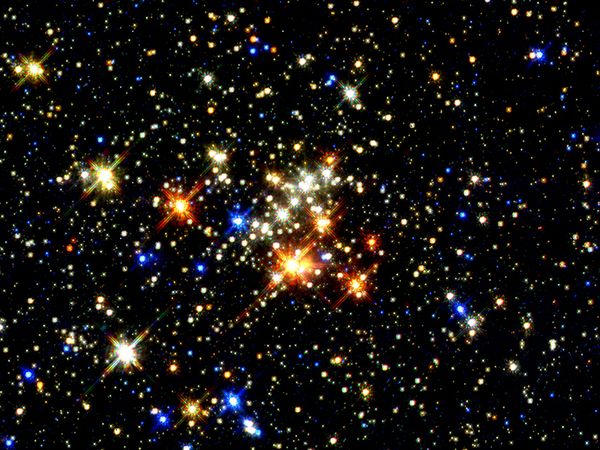
O is the hottest and massive star.
M is the coolest and least massive star.
As we move from O to M temperature decreases, mass decreases and radius decreases.
Each class is further divided into 10 sub classes from 0 to 9 written as O1, B5, A3, G5, K9, M1 etc. The stars belongs to the class 0O is the hottest (surface temperature maximum) and the class M9 is the coolest (surface temperature minimum).
